
IUCRC Program Investment, 2006-2022
The Industry-University Cooperative Research Centers (IUCRC) Program fosters the creation of pre-competitive research by catalyzing the investment of the National Science Foundation (NSF), private businesses, and other federal, state, and local government agencies.
As the IUCRC website explains,
“The IUCRC program provides a structure for academic researchers to conduct fundamental, pre-competitive research of shared interest to industry and government organizations. These organizations pay membership fees to a consortium so that they can collectively envision and fund research, with at least 90% of member funds allocated to the direct costs of these shared research projects.”
As a steward of the IUCRC program evaluation, VentureWell’s IUCRC team wanted to explore the financial investments NSF, private industry, and other entities have made in the Centers. Further below, we show how Centers compare to one another and how individual Centers have developed over time.
We Asked:
- How has program-wide investment changed over time?
- How does inflation affect Centers’ spending power?
- How can Centers best attract funding?
Methods and approach VentureWell’s Evaluation, Data, and Programs staff have adopted the following approach to IUCRC data collection and analysis:
VentureWell’s Evaluation, Data, and Programs staff have adopted the following approach to IUCRC data collection and analysis:
Data Collection
Since 1986, North Carolina State oversaw and implemented the structural data collection effort to understand the financial health of Centers. This work, led by Dennis Gray, Lindsey McGowen, Drew Rivers, and O. Leonshuck, among many others, remains housed at the IUCRC Evaluation Project at North Carolina State, and archived here.
In 2021, data collection and evaluation leadership passed from NC State to VentureWell. Since then, we have been collecting process and outcome data from all IUCRC Centers, based on Center activities for the most recently completed award year. We have collaborated with Centers to maximize the integrity of collected data, and have also consulted with key stakeholders to maintain program fidelity.
Analysis
Since 2021, VentureWell’s Evaluation, Data, and Programs staff have overseen and executed the collection, analysis, and sharing of IUCRC data.
We established the following goals in our evaluation of the IUCRC program:
- Review, evaluate, and adopt methods from precedent.
- Provide key stakeholders with information they need to compare Centers over time.
- Refocus analysis based on the theme and with the Center as the unit of analysis.
- Identify ripe topics for future research.
- Disseminate useful findings to those that can use them.
Our analyses examine the economic, research, and societal impacts of IUCRC in the following themes:
- Program Investment— Financial and non-financial investments into Center operations.
- Workforce Development—Students’ opportunities in the program and the number participating, graduated, and hired.
- Industry and Membership Relations—Industry members’ perceived benefits and engagement with the IUCRC program.
- Intellectual Property Generation—Knowledge generation and transmission to members resulting from Center projects. Further, focus on researchers’ perspectives of the program.
Our analysis of IUCRC data provides the following:
- Program-wide outputs to compare the program to itself over time.
- Interactive dashboards to allow individual Center’s data to be examined alongside all other Centers operating since 2006.
- Examination of crucial approaches that are essential to understanding these concept areas more deeply.
- Our analyses incorporate inflation adjustments:
- We assessed Investment Leverage Ratios from the perspective on NSF and industry members. Noted below, this provides an understanding of how IUCRC provides matching funds for members.
Overall, we found:
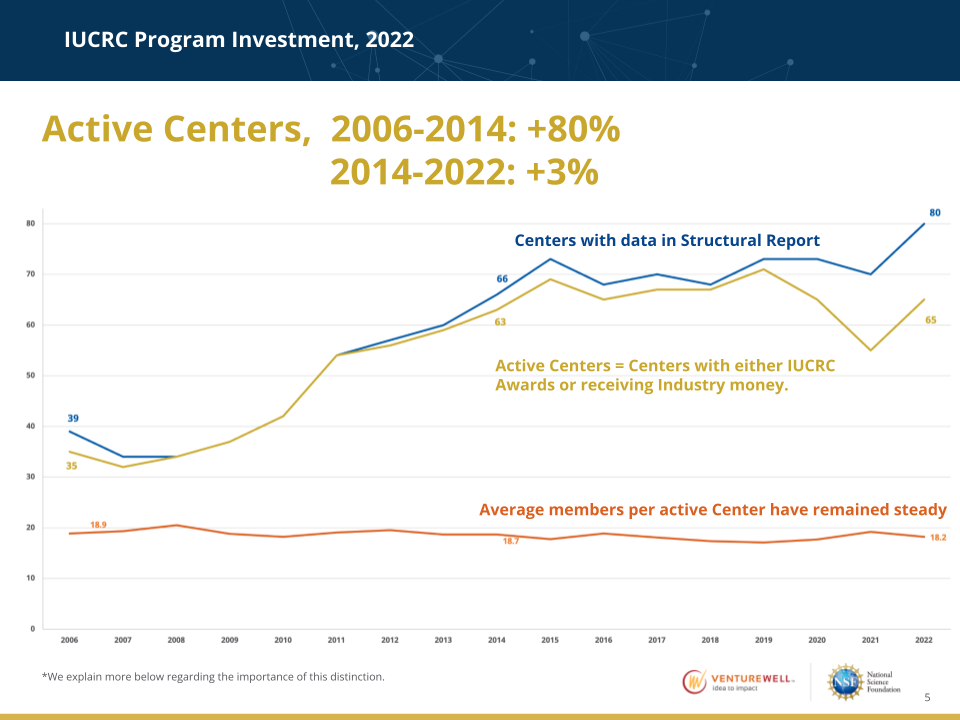
- From 2006-2014, the number of Active Centers, or those that received funding from NSF or industry members, increased by 80%, but by just 3%, between 2014-2022.
- From 2006-2014, Core Program Investment, which pertains to investment from NSF and industry members, grew by 129% but decreased by 11% between 2014 and 2022.
- Centers rely more than ever on industry dollars, as other federal, state, and non-federal investments have all decreased.
- Inflation increases the cost of running a Center over time. Average Center input costs have increased by at least 50% since 2006.
- Leverage Ratios tell part of the story of Centers’ financial health and sustainability, but vary depending on the presence of investment from other sources.
Please see below for more detailed results.
Results
1) How has program-wide investment changed over time?
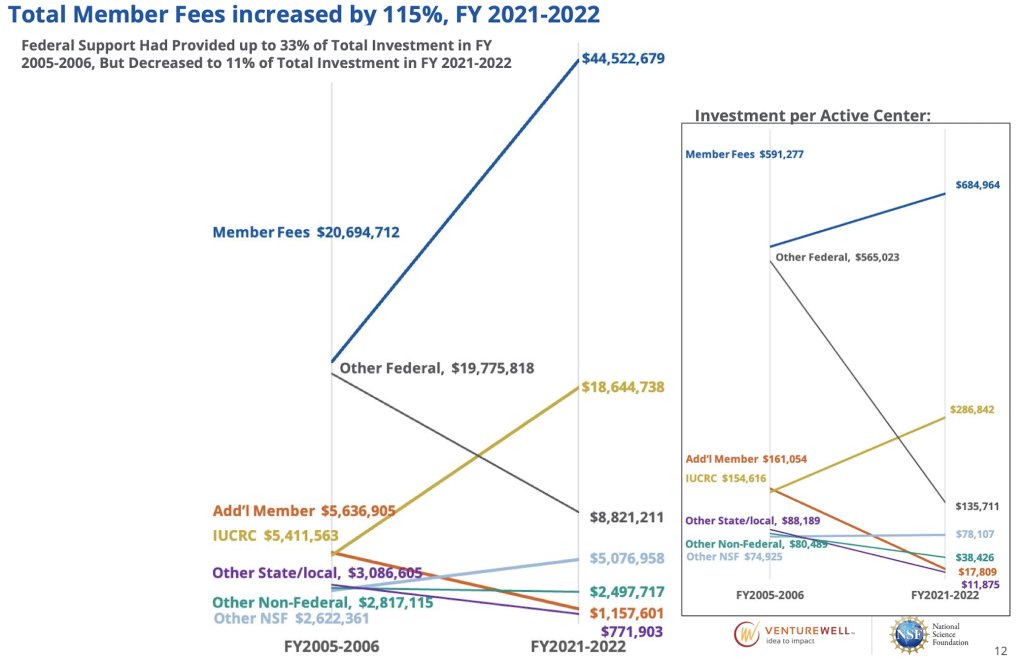
In FY2021-2022, the program attracted approximately $81.5 million from member fees, IUCRC awards, and other federal, state, and local resources.
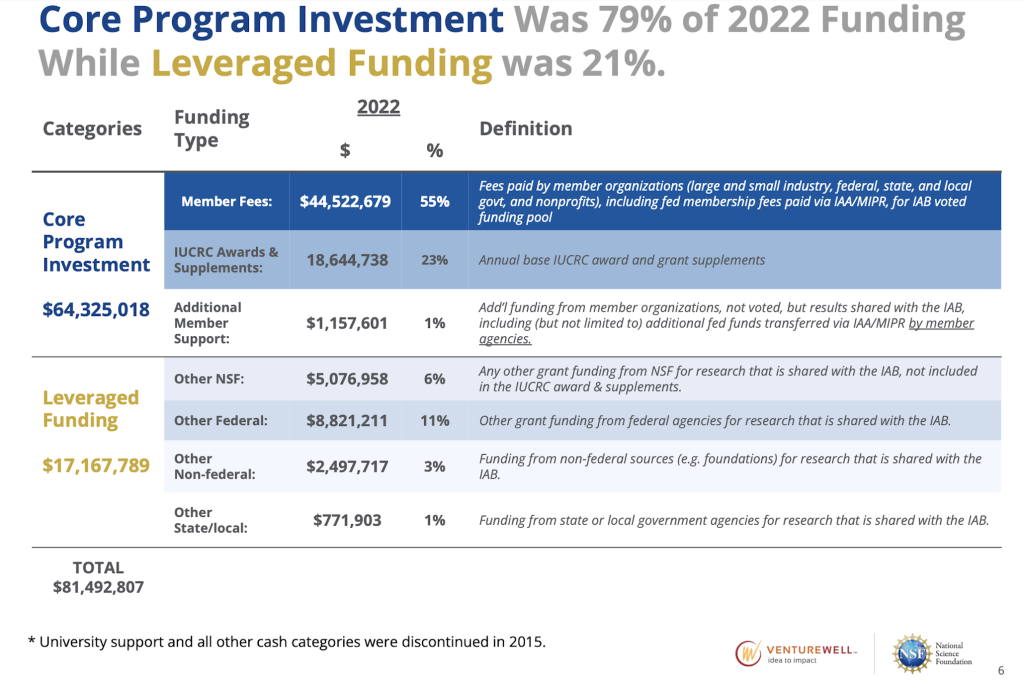
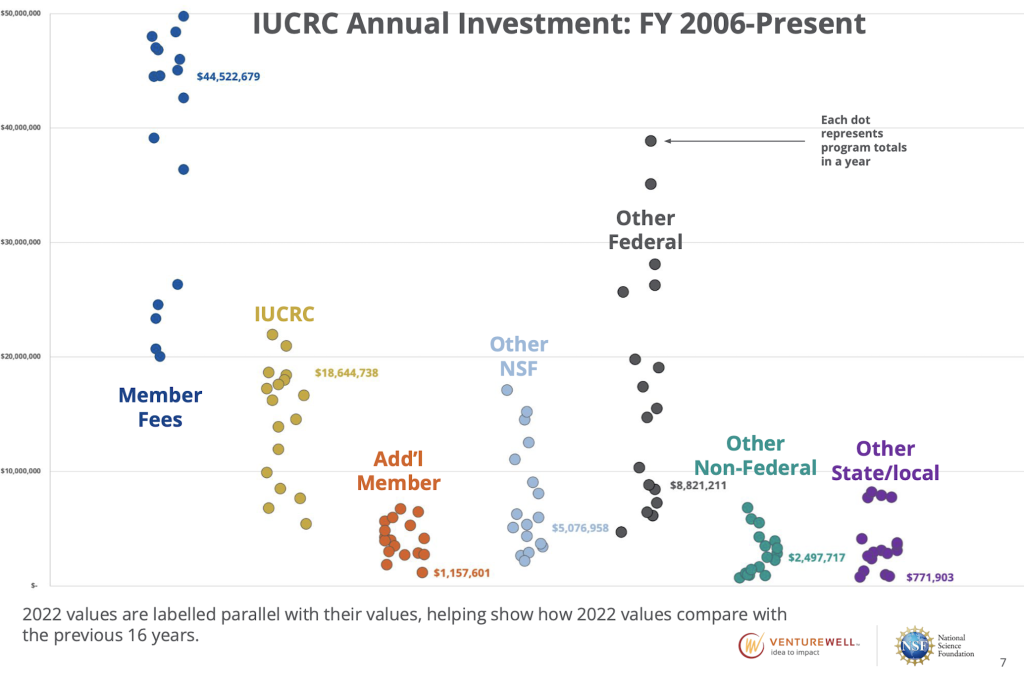
The distribution of Centers’ income sources (e.g., member fees, IUCRC awards and supplements, etc.) was somewhat variable between 2006 and 2022. Most categories have remained consistent over time (Additional Member Funding, and Other non-federal, for example. However, Member fees and other federal sources have varied considerably over time. IUCRC and other NSF funding have varied moderately.
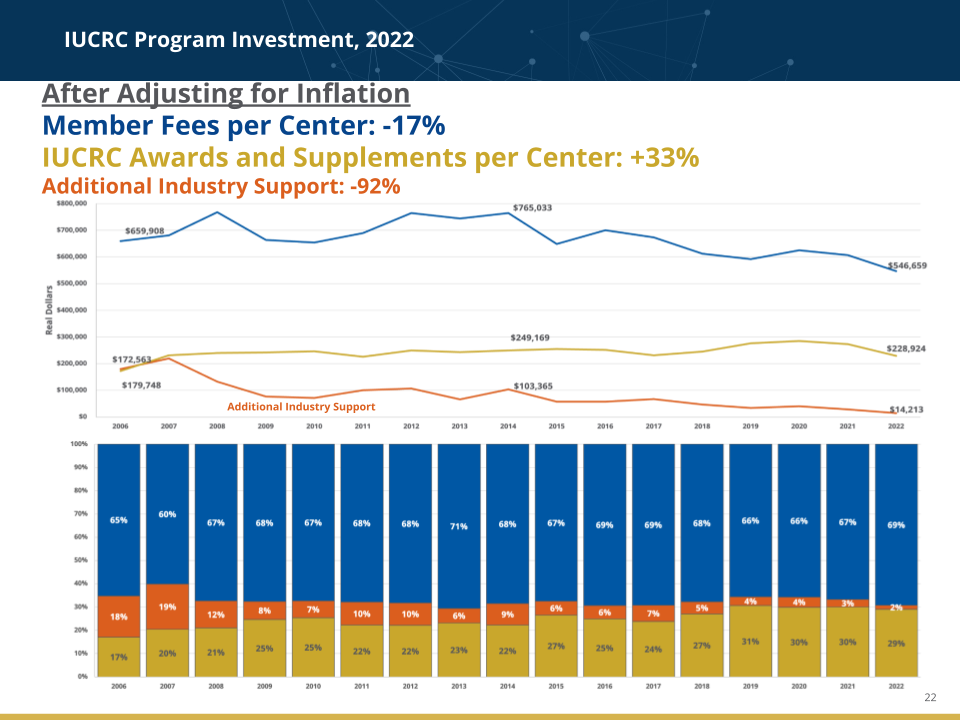
You’ll notice in the chart below that the labelled values are parallel to their most recent value, showing their relative position 16 years of data.
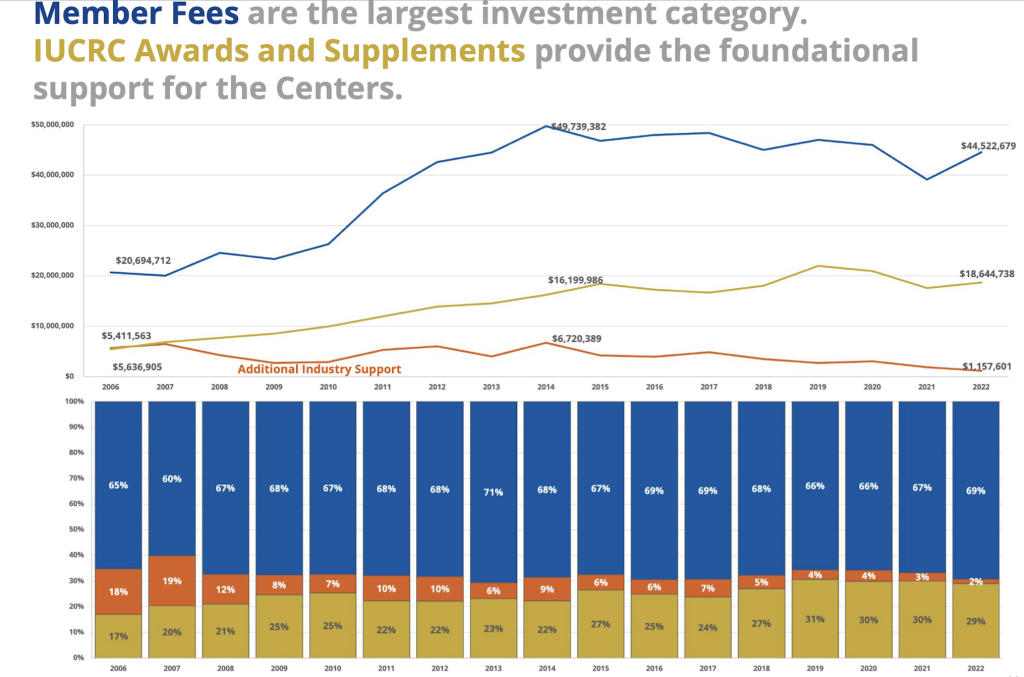
Core Funding (Member Fees plus IUCRC Awards and Supplements) have steadily increased over time in tandem with each other, while funds from additional industry support have remained lower and fairly stable over time.
Between 2006 and 2022, the number of Active Centers and Centers with data in the Structural Report increased, approximately doubling in number between 2006 and 2022.
If we zoom out to look at all funding categories in 2006 and in 2022, one sees that Centers rely more than ever on member fees, as other federal, state, and non-federal investments have all decreased. If we also control for the number of Centers (bottom right), these trends are magnified as the total number of Centers has continued to grow.
Conclusion:
We estimate that private industry, government, and other entities invested $81.5 million in IUCRC in FY2021-2022. The number of Centers grew from 35 to 63 active Centers between 2006 and 2014, but grew only slightly between 2014-2022 to 65 active Centers in 2022.
Since FY2005-2006, the structure of investment has changed significantly for the program. On average, member fees comprise the largest share of Centers’ investment, investment from other Federal sources has decreased over time, and the NSF IUCRC program has invested more in total for each Center to propel Centers’ work.
2) How does inflation affect Centers’ spending power?
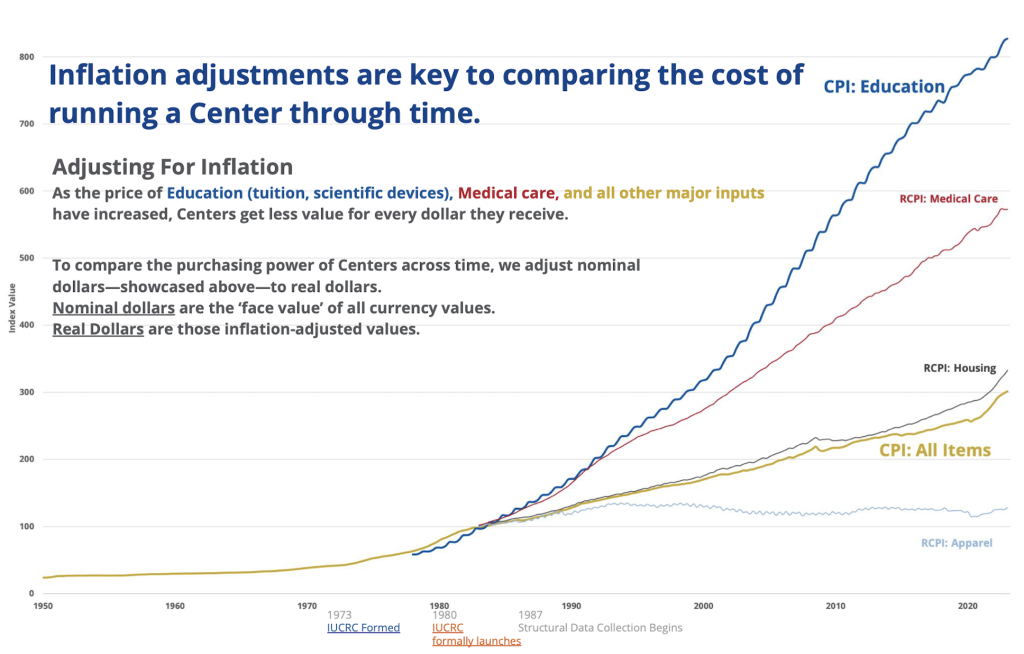
Inflation increases the cost of running a Center and is crucial to consider when examining Centers’ operational costs over time. The figure below shows how one measure of inflation, the Consumer Price Index (CPI), has generally increased over time, as well as within specific sectors such as Education, Medical Care, and Housing.
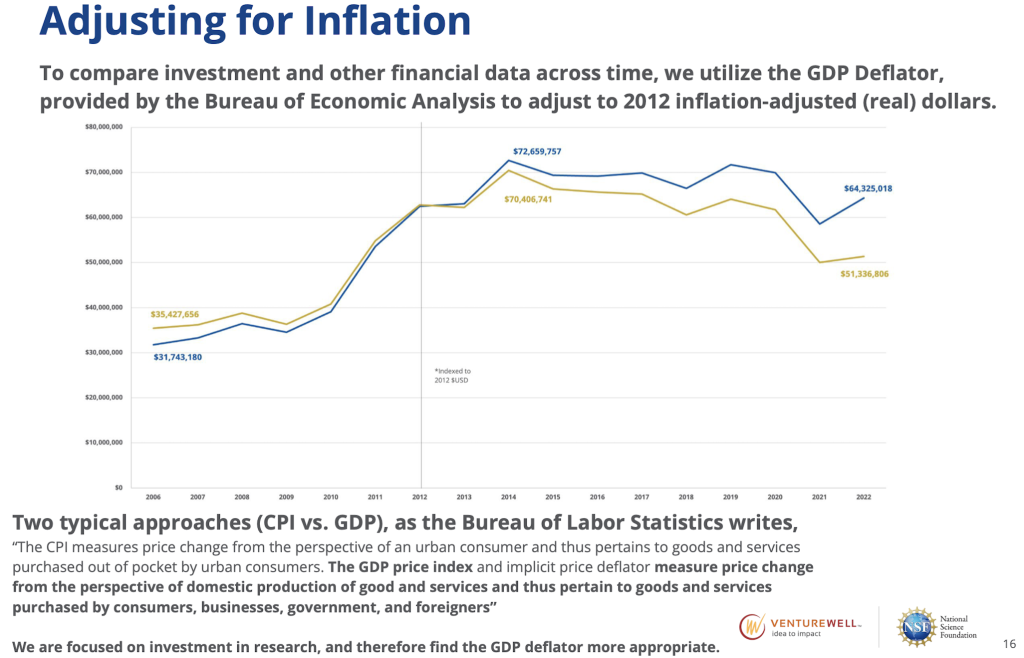
To compare investment data across time, we utilized the GDP Deflator, measured by the Bureau of Economic Analysis, to adjust to 2012 inflation-adjusted (real) dollars. As the Bureau of Labor Statistics wrote (BLS),
The CPI measures price change from the perspective of an urban consumer and thus pertains to goods and services purchased out of pocket by urban consumers. The GDP price index and implicit price deflator measure price change from the perspective of domestic production of good and services and thus pertain to goods and services purchased by consumers, businesses, government, and foreigners, but not importers.
We are focused on investments in scientific research and therefore use the GDP deflator to adjust for inflation.
If we look at the graph above and control for the number of Centers, we may see how Core Income has changed over time. In particular, we see Member fees per Center as overall stable, the steady growth of IUCRC awards and supplements, and a decrease in Additional Industry Member Support.
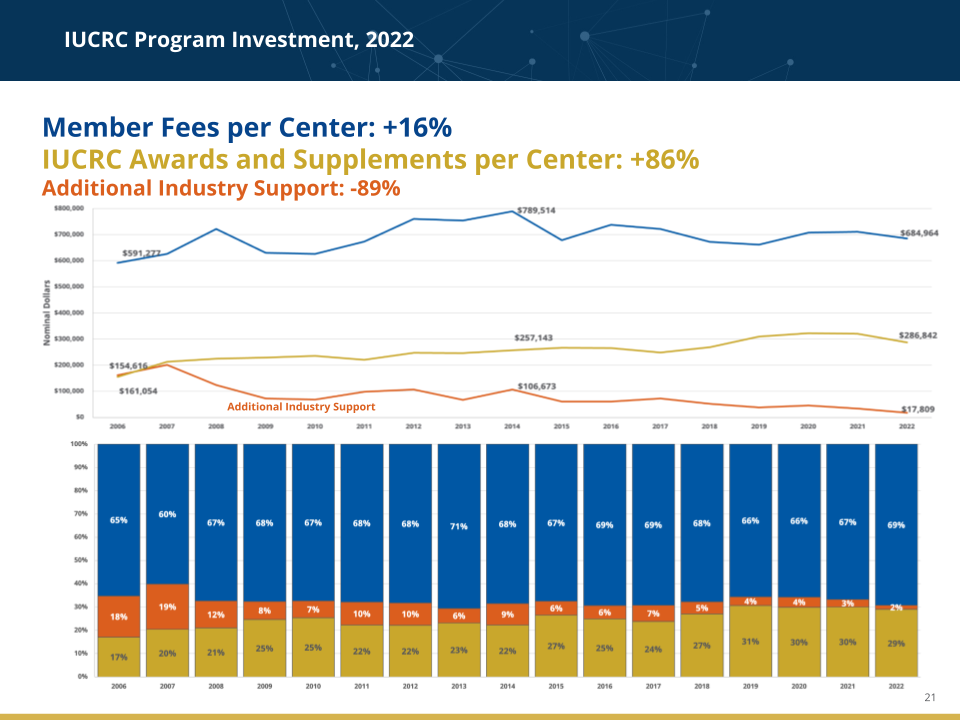
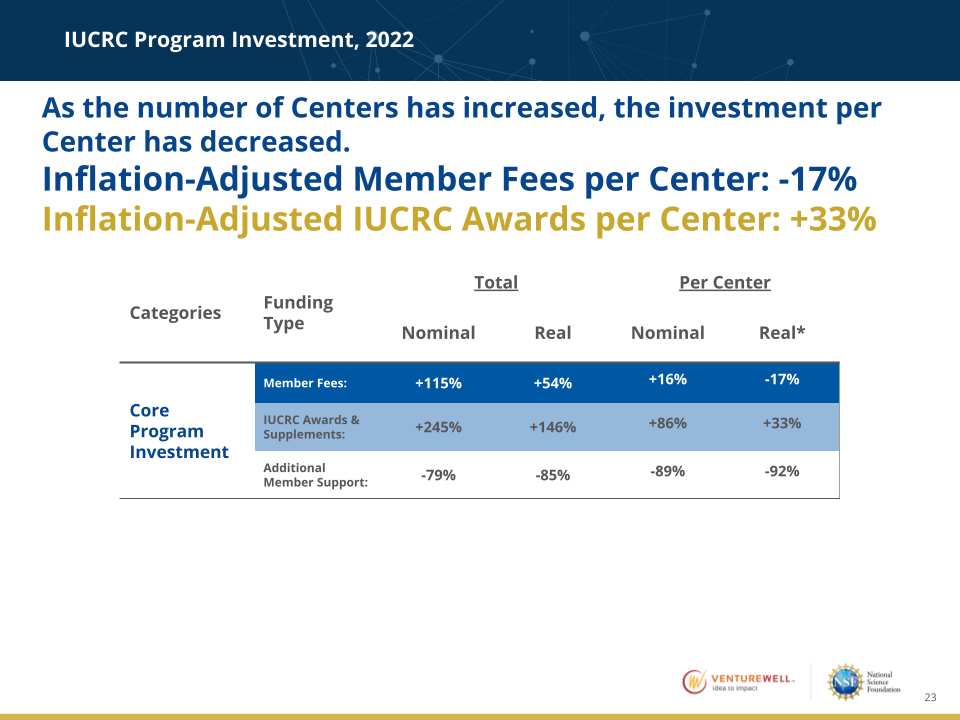
When we control for both the number of Active Centers and inflation, member investment per Center has decreased by at least 17% between 2006 and 2022. Both member fees and additional member fees decreased while NSF-based funds increased in real terms.
More specifically, this table shows how the approach to measuring program investment can significantly impact the trends we observe.
Controlling for Centers and adjusting for inflation both are crucial to understanding some of the factors affecting Center-level investment.
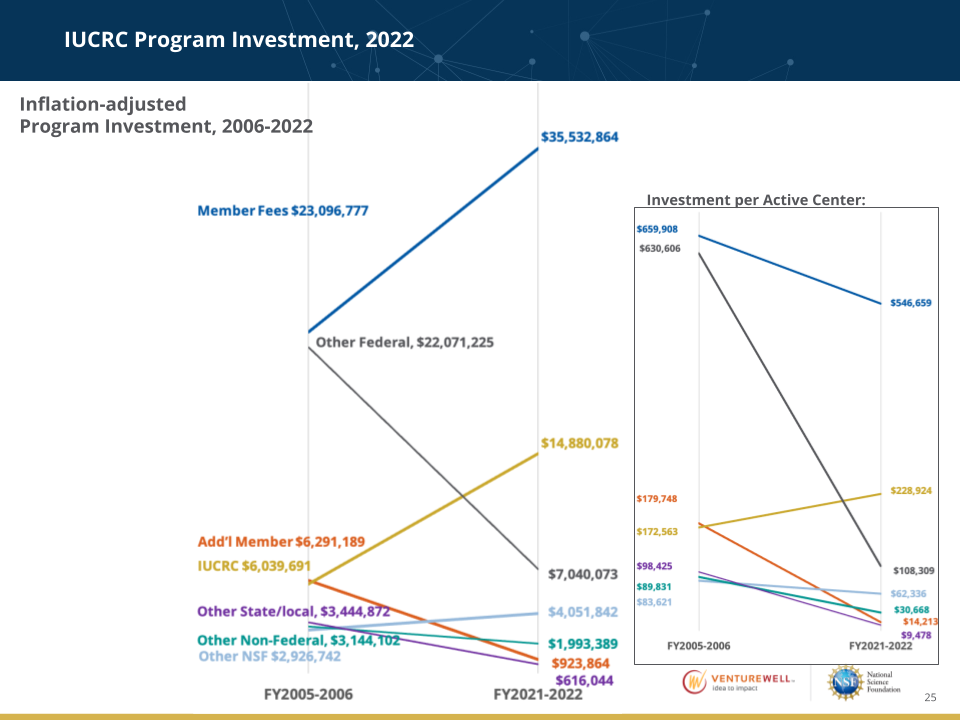
If we zoom out again to look at all categories between 2006 and 2022 and adjust for inflation, the same trend is apparent, but is clearer.
As shown in the figure below, you can see Centers rely more than ever on industry dollars, as other federal, state, and non-federal investments have all decreased. If we control for the number of Centers as well (bottom right), these trends are magnified as Centers have continued to grow.
Conclusion:
The input cost of IUCRC has increased over time, along with nearly all goods and services. We estimate that Average Center input costs have increased by at least 50% since 2006. Additionally, by adjusting for inflation, we can see that the investment from the NSF IUCRC program is the only category of funding that has increased at the Center level since 2006.
3) How Can Centers Best Obtain Funding?
One of the ways to measure Center investment attraction is to compare an entity’s funding to other entities. The two measures utilized in previous iterations of this analysis in the IUCRC Program Findings from The Center Structure Database, FY2020 are the
- NSF Leverage Ratio: The amount of investment from other entities compared to to NSF’s IUCRC Awards and Supplements
- Average Member Leverage Ratio: The amount of investment from all other entities compared to each average member’s investment. This formula (below) is a little bit more complicated so we can show the match for individual companies and other Center members.
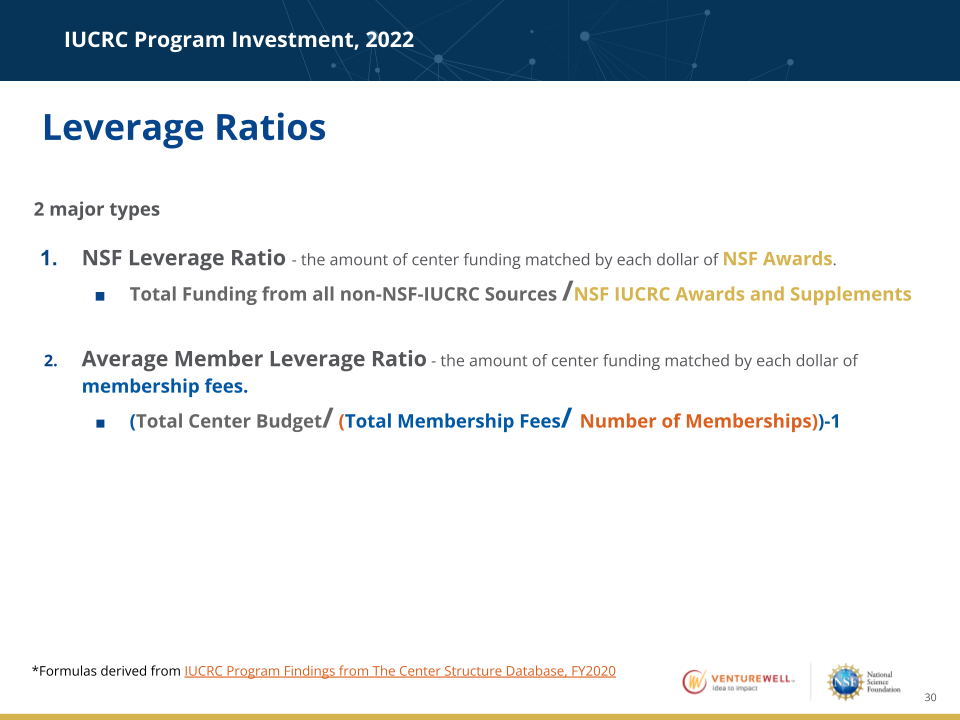
These measures help to show how much specific members, or in this case investors, see their investment matched and are affected inherently by outside investment, such as other Federal Investments.
Two case examples are shown below:
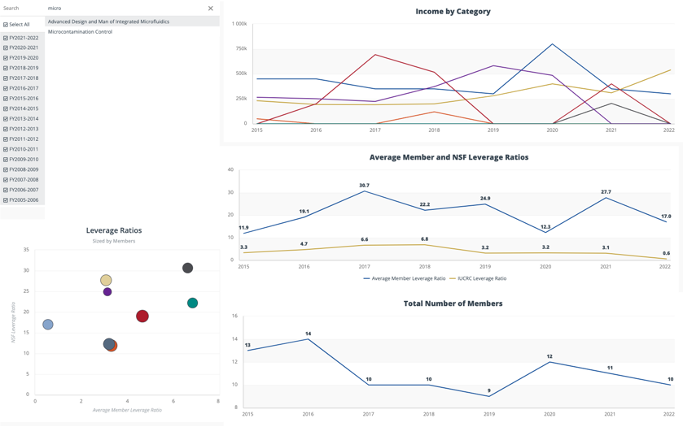
- CADMIM: Center for Advanced Design and Manufacturing of Integrated Microfluidics, and
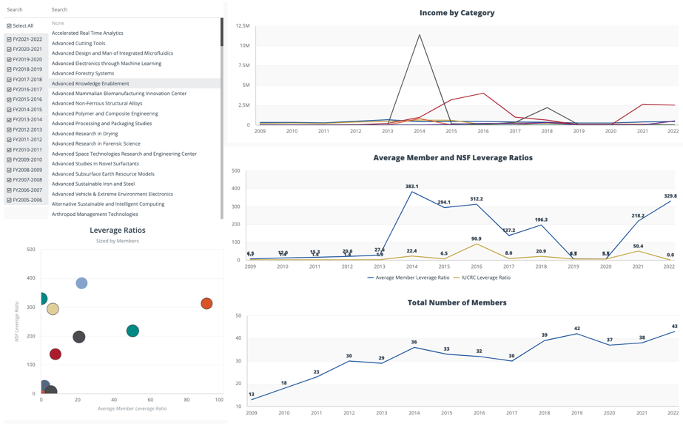
- CAMTECH: Center for Arthropod Management Technologies
As you may see, CADMIM enjoys a diverse income whereas CAMTECH has fewer larger investments from non-member investment and non-IUCRC-based funding, leading to much larger NSF IUCRC Leverage Ratio.
Conclusion:
Historically, analysis of the IUCRC program investment has focused on leverage ratios to identify the extent to which an organization’s investment in IUCRC is matched by other entities, increasing the impact of that organization’s investment. If we look at specific examples of the Average Member Leverage Ratio and the NSF Leverage Ratio, we can see how they relate and are affected by other investments, especially large ones. Every Center’s context is different, but these approaches provide a way to compare Centers to their contemporaneous Centers, as well as to track their investment types over time.
Dashboard:
Explore Centers’ data since 2006 by clicking through the following dashboard. CLICK FOR FULL SCREEN
Want to learn more? You can see the entire presentation here: